INTRODUCTION
Depression is one of the most common and disabling mental illnesses worldwide (1–3). Despite decades of research, the etiology of depression remains unclear. The modern view on the cause of depression is that genetic predispositions interact with environmental factors to initiate depressive episodes in some patients (4–6). However, compared with the known environmental factors (e.g., stressful life events, endocrine abnormalities, and drug adverse effects), enormous gaps remain in our knowledge about the genetic risks for depression (3). Genuine “depression genes,” which are responsible for the onset of depression and can be used to generate disease models in rodents or as potential treatment targets, have not yet been identified by genetic analyses (3, 7, 8).
Intriguingly, evidence that parental life experiences can affect offspring phenotypes in an epigenetically inherited manner (9–11) provokes a consideration of the genetic factors that underlie disease risk for depression. Epigenetic signatures such as DNA methylation, histone modifications, and noncoding RNAs can be transmitted to the next generation through the germ line to induce phenotypes that are related to parental environments (12–14). However, the function, mechanism, and dimension of germline epigenetic inheritance remain poorly understood, especially for father-to-offspring transmission, because sperm were long believed to merely deliver paternal DNA to the oocyte. Recently, sperm RNA is increasingly recognized as an additional source of paternal hereditary information beyond DNA (15–17). A diverse set of RNA species present in sperm can be passed into the oocyte upon fertilization, including microRNAs (miRNAs) (16), transfer RNA (tRNA)–derived small RNAs (tsRNAs) (18), and long RNAs (lRNAs) (mRNAs and long noncoding RNAs) (19). Inherited miRNAs have been found to participate in embryonic development (20), paramutation of the KIT gene (15), and transmission of parental phenotypes to offspring (16, 21), whereas tsRNAs and lRNAs contribute to the intergenerational inheritance of diet-induced metabolic disorders (18) and trauma symptoms (19), respectively. Despite these pioneering studies, the precise mechanism by which sperm RNA might reshape offspring development to recapitulate a paternally acquired phenotype remains enigmatic. Particularly, although paternal exposure to traumatic experiences and stresses may have adverse effects on offspring through sperm RNA (16, 21), whether the pathological symptoms of depression can be transmitted to the subsequent generation via a sperm RNA–mediated intergenerational inheritance is still largely unknown. Here, we focus on the epigenetic inheritance mechanism of depression, especially the potential role of sperm miRNAs in the inheritance and susceptibility to stress-induced depression-like phenotypes in offspring.
RESULTS
Behavioral and gene alterations of chronic mild stress–induced F0 males of depression-like model
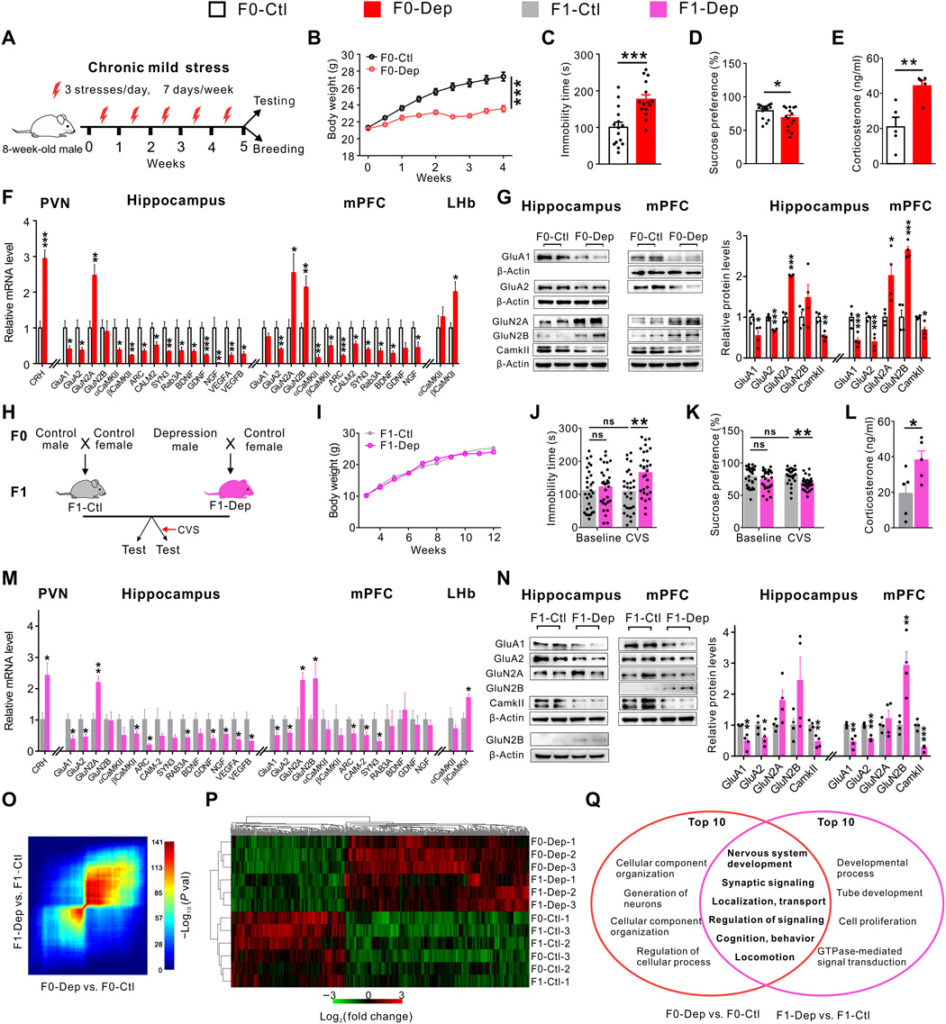
Stress and resilience play critical roles in the development of depression (22–24). Therefore, we first established a chronic mild stress (CMS)–induced depression-like mouse model by exposing male mice to unpredictable mild stresses daily for 5 weeks (Fig. 1A; detailed experimental design is shown in fig. S1). As expected, the CMS-induced F0 males of depression-like model (F0-Dep) showed decreased body weight gain compared to nonstressed F0 control males (F0-Ctl) (Fig. 1B). Moreover, F0-Dep displayed obvious depression-like behaviors related to two core symptom domains, despair and anhedonia, including a longer immobility time in the forced swim test (FST) and a lower sucrose intake in the sucrose preference test (SPT) when compared with F0-Ctl (Fig. 1, C and D). Development of this trait was not due to an alteration in locomotor activity because F0-Dep covered a total distance similar to that of F0-Ctl in an open-field test (fig. S2A). Moreover, the plasma levels of corticosterone, a key hormone in the hypothalamic-pituitary-adrenal (HPA) axis and a well-characterized marker of stress intensity (21, 25), were markedly elevated in F0-Dep (Fig. 1E).

(A) Schematic timeline and behavioral paradigm in F0 generation. (B to E) Body weight changes (n = 15), immobility time in FST (n = 15), percentage of preference for sucrose solution in SPT (n = 15), and plasma corticosterone levels (n = 5) of F0-Dep versus F0-Ctl. (F) Depression-related gene expression in the PVN, hippocampus, mPFC, and LHb of F0-Dep versus F0-Ctl (n = 6). (G) Immunoblot (left) and quantification (right) analyses of glutamate and synaptic proteins in the hippocampus and mPFC of F0-Dep versus F0-Ctl (n = 4). (H) Schematic timeline and behavioral paradigm in F1 generation. (I) Body weight changes of F1-Dep and F1-Ctl (n = 12). (J and K) Behavioral performances in FST and SPT (n = 30). (L) Plasma corticosterone levels of F1-Dep versus F1-Ctl (n = 5). ns, not significant. (M) Depression-related gene expression in the PVN, hippocampus, mPFC, and LHb of F1-Dep versus F1-Ctl (n = 6). (N) Immunoblot (left) and quantification (right) analyses of glutamate and synaptic proteins in the hippocampus and mPFC of F1-Dep versus F1-Ctl (n = 4). (O) Threshold-free comparison of differentially expressed genes by RRHO. (P) Heatmap generated by unsupervised hierarchical clustering (n = 3 pools). (Q) Venn diagram showing the overlap of GO functional categories between F0-Dep (versus F0-Ctl) and F1-Dep (versus F1-Ctl). GTPase, guanosine triphosphatase.
Depression results from maladaptive stress-induced changes in molecular, cellular, and synaptic neurotransmission in various brain regions and discrete neural circuits (7). The paraventricular nucleus of the hypothalamus (PVN), the crucial component of the HPA axis, showed elevated mRNA expression of corticotropin-releasing hormone (CRH) in F0-Dep (Fig. 1F), which was consistent with the increase in the plasma corticosterone level. These results together indicate an excessive HPA axis activation. In addition, the hippocampus (7, 26), medial prefrontal cortex (mPFC) (26, 27), and lateral habenula (LHb) (28–30) are involved in the pathophysiology of depression and jointly constitute an evolutionarily conserved core neural circuit that is essential for flexible and adaptive behavioral responses to environmental conditions and internal states (31). In particular, dysfunction of glutamatergic neurotransmission (32) and loss of neurotrophic factors (6) have been frequently documented in the hippocampus and mPFC of depressed patients. Analyses of the gene expression signatures in the hippocampus and mPFC of F0-Dep revealed aberrant expression of glutamate signaling genes (down-regulation of GluA1 and GluA2 and up-regulation of GluN2A and/or GluN2B) and reduced expression of synaptic plasticity genes (αCamKII, βCamKII, and ARC), synaptic structural genes (calmodulin-2, synapsin-3, and Rab3A), and neurotrophic factor genes [brain-derived neurotrophic factor (BDNF), glial cell line–derived neurotrophic factor (GDNF), nerve growth factor (NGF), vascular endothelial growth factor A (VEGFA), and VEGFB] (Fig. 1F). In contrast, βCamKII expression was notably up-regulated in LHb (Fig. 1F), which is also consistent with a previous report (30). Immunoblotting analysis validated the aberrant expression of glutamate receptor subunits and signaling proteins mediating synaptic transmission and plasticity in the hippocampus and mPFC of F0-Dep (Fig. 1G).
Paternal transmission of stress-induced depression-like symptoms to offspring
Next, we designed experimental strategies (33) to investigate whether depressive traits in fathers are inherited by the offspring. Briefly, F0-Dep and F0-Ctl were separately mated with healthy females, and their F1 offspring were screened for depression-like symptoms after becoming adults (Fig. 1H; detailed experimental design is shown in fig. S1). Despite being born to F0-Dep, the F1 offspring of depression-like model (F1-Dep) grew normally and had the same weight gain as F1 control offspring (F1-Ctl) (Fig. 1I). Under baseline conditions, F1-Dep also showed an immobility time and sucrose intake similar to those of F1-Ctl (Fig. 1, J and K). However, intriguingly, after exposure to a slight chronic variable stress (CVS) lasting for 2 weeks (34), F1-Dep recapitulated the paternal depressive-like phenotypes, including a significantly longer floating time and less sucrose consumption, whereas F1-Ctl did not express depressive-like behaviors (Fig. 1, J and K). The open-field test confirmed that these behavioral phenotypes in F1-Dep were independent of locomotor activity (fig. S2B). In addition, plasma corticosterone levels were remarkably increased in F1-Dep (Fig. 1L). To validate the relevance of environmental stimuli for the incidence of depression-like symptoms in offspring, we gradually strengthened the CVS procedure from 1 to 3 weeks. While 1 week of CVS was not sufficient to induce increased immobility and decreased sucrose consumption in F1-Dep, 2 or 3 weeks of CVS generated an apparent depression-like behavior in F1-Dep (fig. S2, C and D). Moreover, the behavioral assays were separately assessed on F1 males and females, and both genders exhibited a similar tendency to acquire the depression-like phenotypes after CVS exposure (fig. S2, E and F). The transmission of stress vulnerability across generations was also observed in another depression-like model established by chronic restraint stress (CRS) (fig. S3, A and B). Similar to the CMS model, the F1 offspring (F1-Dep) born to F0 males of depression-like model (F0-Dep) exhibited normal behavioral performances under baseline conditions (fig. S3, C to E) but were more vulnerable to depressive-like behaviors than F1-Ctl when exposed to a slight CVS (fig. S3, C to E). These results indicate that the F1 offspring of F0-Dep display reduced resilience to stress and enhanced susceptibility to depression-like phenotypes, although they appear normal under baseline conditions.
To explain the observed depression-like behaviors in F1-Dep, we performed molecular profiling in several key brain regions related to depression. F1-Dep had gene expression signatures similar to those of F0-Dep when exposed to CVS, characterized by overexpression of CRH mRNA in the PVN; dysregulation of mRNAs of glutamate receptors, synaptic proteins, and neurotrophic factors in the hippocampus and mPFC; and up-regulation of GluA1/2, Rab3A, BDNF, and βCamKII mRNAs in the LHb (Fig. 1M and fig. S4A). Immunoblotting analysis confirmed the aberrant expression of glutamate signaling and synaptic proteins in the hippocampus and mPFC of F1-Dep (Fig. 1N). Furthermore, genome-wide RNA sequencing was performed to capture transcriptome alterations in the hippocampus of F0-Dep and F1-Dep compared with those in nonstressed F0-Ctl and F1-Ctl. Rank-rank hypergeometric overlap (RRHO) analysis, used to identify patterns and strengths of genome-wide overlap in a threshold-free manner, indicated a substantial overlap of the up-regulated and down-regulated hippocampal genes between F0-Dep versus F0-Ctl and F1-Dep versus F1-Ctl (Fig. 1O). Hierarchical clustering also revealed similar hippocampal gene profiles in F0-Dep and F1-Dep, while the gene profile in F0-Ctl and F1-Ctl was in a distinct cluster group (Fig. 1P). Then, a gene ontology (GO) clustering analysis was performed to look for biological processes that might be associated with these altered genes. Among the 10 top-ranked GO clusters in each group, 6 GO clusters are shared between F0-Dep versus F0-Ctl and F1-Dep versus F1-Ctl, and these overlapped GO functional categories are directly related to “nervous system development,” “synaptic signaling,” “localization, transport,” “regulation of signaling,” “cognition, behavior,” and “locomotion” (Fig. 1Q and table S1). These data strongly suggest that F1 offspring born to F0-Dep may have impaired neural function as a result of maladaptive molecular and signaling changes and are therefore more susceptible to stress-induced depression-like symptoms.
Abnormal neuronal activation and synaptic transmission in F0 males of depression-like model is conferred to offspring
To dissect the functional changes in the hippocampus, mPFC, and LHb, we assessed neuronal activation and synaptic transmission by c-Fos immunocytochemistry, a sensitive marking technique for neuronal activation, and whole-cell patch-clamp recordings on brain slices. In accordance with the increase in CRH mRNA and plasma corticosterone, CRHergic neurons were significantly activated in the PVN of F0-Dep compared with those of F0-Ctl (Fig. 2, A and D, and fig. S5A). Accordingly, CRHergic neurons were apparently activated in the PVN of F1-Dep compared with those of F1-Ctl (Fig. 2, A and D, and fig. S5A), suggesting a significant increase in HPA axis activity in F1-Dep. Likewise, an apparent increase in neuronal activation was also observed in the LHb of F1-Dep (fig. S4, B and C). However, neuronal activation was markedly silenced in the hippocampus and mPFC of F0-Dep compared with that in F0-Ctl (Fig. 2, B, C, E, and F, and fig. S5, B and C). Accordingly, a pronounced decrease in neuronal activation was observed in the hippocampus and mPFC of F1-Dep compared with that in F1-Ctl (Fig. 2, B, C, E, and F, and fig. S5, B and C). These results are consistent with the notion that depression is associated with reduced neuronal activation in the hippocampus and mPFC, whereas hyperactivity of LHb and PVN plays a causal role in depression (7, 26, 27, 29, 30). Furthermore, both the frequencies and amplitudes of spontaneous excitatory postsynaptic currents (sEPSCs) were significantly decreased in the hippocampal and mPFC pyramidal neurons of F0-Dep compared with those in F0-Ctl (Fig. 2, G and H, top), and a similar degree of decline was observed in the hippocampal and mPFC pyramidal neurons of F1-Dep compared with those in F1-Ctl (Fig. 2, G and H, bottom). These results suggest that the synaptic transmission and neuronal activity profiles in the neural circuits of F1-Dep were similar to those of F0-Dep despite the fact that F1-Dep were reared normally and did not undergo stress exposure like F0-Dep.

(A and D) Triple immunostaining for CRH (red), c-Fos (green), and 4′,6-diamidino-2-phenylindole (DAPI) (blue) showing the activation of CRH neurons in the PVN of F0-Dep versus F0-Ctl and F1-Dep versus F1-Ctl under baseline conditions (n = 4). (B and E) Triple immunostaining for NeuN (red), c-Fos (green), and DAPI (blue) showing the neuronal activation in the hippocampus of F0-Dep versus F0-Ctl and F1-Dep versus F1-Ctl under baseline conditions (n = 4). Circles indicate the activated neurons. GrDG, granular layer of the dentate gyrus; PoDG, polymorph layer of the dentate gyrus; MoDG, molecular layer of the dentate gyrus. (C and F) Neuronal activation in the mPFC of F0-Dep versus F0-Ctl and F1-Dep versus F1-Ctl under baseline conditions (n = 4). Circles indicate the activated neurons. PrL, prelimbic; Cg1, cingulate cortex, area 1; IL, infralimbic cortex. (G) Raw current traces showing sEPSCs recorded in the hippocampal pyramidal neurons, and the cumulative distribution of sEPSC interevent interval and amplitude with the average frequency and amplitude (insets) of F0-Dep versus F0-Ctl and F1-Dep versus F1-Ctl under baseline conditions (n = 11 to 12 neurons from five mice per group). (H) Frequency and amplitude of sEPSCs in the mPFC pyramidal neurons of F0-Dep versus F0-Ctl and F1-Dep versus F1-Ctl under baseline conditions (n = 10 neurons from five mice per group).
Behavioral performances of F2 offspring born to F1 offspring of depression-like model
Subsequently, we determined whether the depressive-like traits would be transmitted to the F2 generation. Males of F1-Dep and F1-Ctl were bred with normal females, and the F2 offspring (F2-Dep versus F2-Ctl) were examined (fig. S6A; detailed experimental design is shown in fig. S1). Compared with F2-Ctl, F2-Dep showed no susceptibility to a CVS stimulus (fig. S6, B and C), indicating an intergenerational rather than transgenerational inheritance of depression susceptibility. These results are consistent with previous observations that mammals rarely have transgenerational epigenetic inheritance, whereas in plants, worms, and yeast, phenotypic transmission can span multiple generations (9, 14).
Sperm sRNAs contribute to paternal transmission of depression-like symptoms
Such father-to-offspring transmission excludes the maternal effects and suggests the vital position of the paternal germ line as the carrier of intergenerational information. Increasing evidence suggests that paternal characteristics acquired during environmental exposures can be inherited by future generations through the sperm (9, 10, 13), yet the active components of sperm that interlink paternal environment and offspring outcomes remain to be elucidated. Sperm RNA, previously considered to be negligible remnants of spermatogenesis, was recently shown to be transmitted to the zygotes during fertilization (16, 18, 21, 35). To assess whether sperm RNA is associated with the increased incidence of depression-like phenotypes in offspring, we purified total RNAs from the sperm of F0-Dep or F0-Ctl mice and injected them into normal zygotes (RNA injection was normalized to the amount of approximately 10 sperm) (16, 18), and then, the embryos were transferred into surrogate mothers to generate offspring (RNA-Dep versus RNA-Ctl); diethylpyrocarbonate (DEPC) water instead of sperm was processed for RNA isolation and injected into normal zygotes, and the resulting offspring served as a mock control (fig. S7A; detailed experimental design is shown in fig. S1). RNA-Ctl exhibited no difference in behaviors compared with mock control (fig. S7, B and C), indicating that the injection of sperm RNA from F0-Ctl into zygotes did not affect offspring phenotypes. While RNA-Dep displayed no obvious depressive-like behaviors under baseline conditions in comparison with RNA-Ctl (fig. S7, B and C), RNA-Dep developed significant depressive-like behaviors in response to CVS (fig. S7, B and C). Overall, injection of sperm RNA into zygotes produced the same depressive-like behavioral alterations in the resulting offspring as those born to stress-induced F0-Dep.
To narrow the active components in sperm RNA, we specifically enriched small RNA (sRNA; <200 nt) fraction from sperm of F0-Dep and F0-Ctl and microinjected into wild-type zygotes to generate in vitro fertilization (IVF) offspring (sRNA-Dep versus sRNA-Ctl; sRNA injection was normalized to the amount of approximately 10 sperm), and equal amount of synthetic scrambled RNA (scrRNA; random sequences and 0 to 50 nt in length) was processed for RNA isolation instead of sperm and injected into zygotes to generate mock control offspring (Fig. 3A; detailed experimental design is shown in fig. S1). While sRNA-Dep, sRNA-Ctl, and mock control exhibited same behavioral performances under baseline conditions (Fig. 3, B and C), and sRNA-Ctl and mock control showed similar behavioral performances after exposure to CVS (Fig. 3, B and C), sRNA-Dep were more susceptible to depression-like behaviors induced by CVS, including a longer immobility time in FST and a lower sucrose intake in SPT (Fig. 3, B and C). Compared with sRNA-Ctl, sRNA-Dep showed abnormal activation of the HPA axis, including elevated plasma corticosterone levels (Fig. 3D), stimulated CRH expression (Fig. 3E), and increased activation of CRHergic neurons in the PVN (Fig. 3F and fig. S8A). Likewise, a pronounced increase in depression-related genes and neuronal activation was observed in the LHb of sRNA-Dep compared with sRNA-Ctl (fig. S9). Furthermore, aberrant expression of depression-related genes/proteins (Fig. 3, G, H, and J) and decreased neuronal activation (Fig. 3, I and K, and fig. S8, B and C) were observed in the hippocampus and mPFC of sRNA-Dep compared with sRNA-Ctl. Moreover, both the frequency and amplitude of sEPSCs were decreased in the hippocampal and mPFC pyramidal neurons of sRNA-Dep (Fig. 3, L and M). In addition, we specifically enriched lRNA (> 200 nt) fraction from sperm of F0-Dep and F0-Ctl and microinjected it into wild-type zygotes to generate IVF offspring (lRNA-Dep versus lRNA-Ctl) (fig. S10A). lRNA-Dep did not display apparent depression-like behaviors compared with lRNA-Ctl both under baseline conditions and after CVS exposure (fig. S10, B and C). These results demonstrate that sperm sRNAs rather than lRNAs contribute to the effect of sperm RNAs on inducing depressive-like symptoms in offspring.

(A) Schematic timeline and behavioral paradigm in IVF offspring born to zygotes injected with sperm sRNA (sRNA-Dep versus sRNA-Ctl/Mock-Ctl). (B and C) Behavioral performances in FST and SPT (Mock-Ctl, n = 18; sRNA-Ctl or sRNA-Dep, n = 33 to 34) under baseline conditions or after exposure to CVS. (D) Plasma corticosterone levels of sRNA-Dep versus sRNA-Ctl under baseline conditions (n = 5). (E) CRH mRNA expression in the PVN of sRNA-Dep versus sRNA-Ctl exposed to CVS (n = 6). (F) Activation of CRH neurons in the PVN of sRNA-Dep versus sRNA-Ctl under baseline conditions (n = 4). (G) Depression-related gene expression in the hippocampus, mPFC, and LHb of sRNA-Dep versus sRNA-Ctl exposed to CVS (n = 6). (H and J) Immunoblot (top) and quantification (bottom) analyses of glutamate and synaptic proteins in the hippocampus and mPFC of sRNA-Dep versus sRNA-Ctl exposed to CVS (n = 4). (I and K) Neuronal activation in the hippocampus and mPFC of sRNA-Dep versus sRNA-Ctl under baseline conditions (n = 4). (L and M) Frequency and amplitude of sEPSCs in the hippocampal and mPFC pyramidal neurons of sRNA-Dep versus sRNA-Ctl under baseline conditions (n = 9 neurons from five mice per group).
sRNA profiles are differentially expressed in sperm after exposure to stress
Sperm carry a population of sRNAs, including miRNAs, PIWI-interacting RNAs (piRNAs) and tsRNAs (36, 37). To identify which specific subtypes of sperm sRNAs cause abnormalities in offspring, we examined the sRNA profiles of sperm derived from F0-Dep and F0-Ctl by RNA deep sequencing. Length distribution analysis revealed similar sRNA compositions in sperm from F0-Dep and F0-Ctl (fig. S11A). Analysis of differentially expressed sRNAs using a stringent threshold (mean reads > 500, fold change > 2, and P < 0.05) identified 19 miRNAs, 24 piRNAs, and 0 tsRNAs that were significantly altered in F0-Dep sperm compared with those in F0-Ctl sperm (Fig. 4A and tables S2 and S3). A larger proportion of miRNAs (18 up-regulated versus 1 down-regulated) showed increased expression in F0-Dep sperm, while most piRNAs (6 up-regulated versus 18 down-regulated) exhibited a decreasing trend (Fig. 4A). Quantitative reverse transcription polymerase chain reaction (RT-PCR) analysis confirmed the accuracy of RNA deep sequencing. In total, 16 and 1 miRNAs were validated to be significantly up- and down-regulated in F0-Dep sperm, respectively; 1 and 5 piRNAs were significantly up- and down-regulated in F0-Dep sperm, respectively; and 0 tsRNAs were significantly altered in F0-Dep sperm (Fig. 4B). Intriguingly, when the 19 miRNAs were assessed in the sperm of F1-Ctl and F1-Dep (under baseline condition without CVS stimulus), no miRNA was found to be significantly changed in F1-Dep sperm (fig. S11C). These results are consistent with the observation that the depressive-like traits could not be transmitted from F1 to the F2 generation. In summary, the above results illustrate that sRNAs are indeed very sensitive to paternal stress experience and are differentially expressed in sperm after exposure to stress.

(A) Scatter plot comparison illustrating sperm sRNAs that were differentially expressed between F0-Dep and F0-Ctl (n = 3). (B) Quantitative RT-PCR analysis of the expression of sperm sRNAs in F0-Dep versus F0-Ctl (n = 10). (C) Schematic timeline and behavioral paradigm in IVF offspring born to zygotes injected with miRNA antisense strands (F1-Dep + Anti or F1-Ctl + Anti) or with scrRNA (F1-Dep + scrRNA or F1-Ctl + scrRNA). (D and E) Behavioral performances in FST (n = 30 to 47) and SPT (n = 30 to 47) after exposure to CVS. (F) Plasma corticosterone levels in F1-Dep + Anti, F1-Ctl + Anti, F1-Dep + scrRNA, and F1-Ctl + scrRNA under baseline conditions (n = 10). (G) Activation of CRH neurons in the PVN of F1-Dep + Anti, F1-Ctl + Anti, F1-Dep + scrRNA, and F1-Ctl + scrRNA under baseline conditions (n = 4). (H) Neuronal activation in the hippocampus and mPFC of F1-Dep + Anti, F1-Ctl + Anti, F1-Dep + scrRNA, and F1-Ctl + scrRNA under baseline conditions (n = 4). (I and J) Frequency and amplitude of sEPSCs in the hippocampal and mPFC pyramidal neurons of F1-Dep + Anti, F1-Ctl + Anti, F1-Dep + scrRNA, and F1-Ctl + scrRNA under baseline conditions (n = 9 to 15 neurons from five mice per group).
Behavioral, neuronal, and gene alterations of IVF offspring born to zygotes injected with synthetic miRNAs
Because miRNAs have a well-established regulatory role in embryonic development, inherited miRNAs are hypothesized to reshape offspring development toward depression-like phenotypes. Thus, a subset of synthetic miRNAs mimicking the 16 most highly expressed sperm miRNAs in F0-Dep or equal amounts of scrRNA were injected into normal zygotes (miRNAs were injected at levels equivalent to natural conditions), and the IVF offspring were assessed for depression-like phenotypes (miRNA-Dep versus scrRNA-Ctl) (fig. S12A; detailed experimental design is shown in fig. S1). Although no behavioral alterations (fig. S12, B and C) were exhibited by the offspring under baseline conditions, miRNA-Dep had a higher vulnerability to depression-like behaviors in response to CVS (fig. S12, B and C). The plasma corticosterone levels were also higher in miRNA-Dep than in scrRNA-Ctl (fig. S12D). Moreover, neuronal activation in depression-related brain regions of miRNA-Dep was also reshaped to an abnormal state (fig. S12, E to G). In addition, miRNA-Dep had a neuroelectrophysiological phenotype similar to that of F0-Dep (fig. S12, H and I). A portion of marker genes recapitulating depression signatures was also aberrantly expressed in miRNA-Dep, including overexpression of CRH in PVN and down-regulation of some glutamate receptors, synaptic plasticity genes, and neurotrophic factors in the hippocampus and mPFC (fig. S12J). Thus, miRNA-mediated epigenetic mechanisms might at least partially contribute to the intergenerational transmission of stress-induced depression vulnerability.
Adjusting the imbalance of miRNAs in zygotes rescues the abnormalities in the F1 offspring born to F0 males of depression-like model
To investigate whether depression inheritance is mediated causally via a specific group of miRNAs, we first fertilized normal oocytes by sperm from F0-Dep or F0-Ctl, and then, a combination of miRNA antisense strands designed to block the 16 increased sperm miRNAs was injected at the zygote stage to neutralize the effects of inherited sperm miRNAs and generate IVF offspring (F1-Dep + Anti or F1-Ctl + Anti); for the control groups, normal oocytes were fertilized by sperm from F0-Dep or F0-Ctl and then injected with scrRNA to generate IVF offspring (F1-Dep + scrRNA or F1-Ctl + scrRNA) (Fig. 4C; detailed experimental design is shown in fig. S1). Under baseline conditions, there were no differences in behavioral performances between these four groups (fig. S13, A and B). After CVS exposure, F1-Dep + scrRNA exhibited considerable depression-like behaviors compared with F1-Ctl + scrRNA, whereas F1-Dep + Anti displayed relatively normal behavioral performances nearly equal to those in F1-Ctl + scrRNA (Fig. 4, D and E). As a control, F1-Ctl + Anti did not display depressive-like behaviors compared with F1-Ctl + scrRNA (Fig. 4, D and E), indicating that injection of miRNA antisense strands into zygotes alone had no obvious effect on offspring phenotypes. Likewise, F1-Ctl + Anti and F1-Ctl + scrRNA had similar plasma corticosterone levels, whereas the high plasma corticosterone levels in F1-Dep + scrRNA were significantly decreased in F1-Dep + Anti (Fig. 4F). Moreover, while F1-Ctl + Anti displayed normal neuronal activation and synaptic transmission compared with F1-Ctl + scrRNA, the aberrations of neuronal activation and synaptic transmission in the PVN, hippocampus, and mPFC of F1-Dep + scrRNA were significantly attenuated in F1-Dep + Anti and recovered to nearly normal states as compared with F1-Ctl + scrRNA (Fig. 4, G to J, and fig. S13, C to E). To validate again that the miRNA antisense strands can counteract the vulnerability to depression-like phenotypes triggered by inherited miRNAs, we compared offspring born to zygotes coinjected with miRNA antisense strands and sperm RNA from F0-Dep (RNA-Dep + Anti) with those with sperm RNA from F0-Dep or F0-Ctl along with scrRNA (RNA-Dep + scrRNA or RNA-Ctl + scrRNA) (fig. S14A). Offspring of these three groups had similar behavioral responses under baseline conditions (fig. S14, B and C). While RNA-Dep + scrRNA exhibited increased risk for depression-like behaviors compared with RNA-Ctl + scrRNA, RNA-Dep + Anti were not susceptible to depression-like behaviors under a CVS stimulus (fig. S14, B and C). Accordingly, the increased plasma corticosterone levels and abnormal neuronal activation and synaptic transmission in RNA-Dep + scrRNA were restored to normal states in RNA-Dep + Anti (fig. S14, D to L).
Sperm sRNAs from depression-like model reprogram early embryonic transcriptional profiles
We further investigated the mechanism by which sperm sRNAs contribute to depression inheritance. Because the early embryonic period represents a window of plasticity important for adult phenotypes, we injected sperm sRNAs from F0-Dep or F0-Ctl into zygotes and assessed miRNA alterations when the embryos developed to the E3.5 (embryonic day 3.5) blastocyst stage (sRNA-Dep-E3.5 versus sRNA-Ctl-E3.5). Among the 16 overexpressed miRNAs in the sperm of F0-Dep, 13 exhibited a 1.5- to 4-fold increase in sRNA-Dep-E3.5 embryos (fig. S15A). Furthermore, when we injected synthetic mimics of 16 miRNAs or equal amounts of scrRNAs into normal zygotes and assessed miRNA alterations in the E3.5 blastocyst stage (miRNA-Dep-E3.5 versus scrRNA-Ctl-E3.5), 15 were found to have a two- to sixfold increase in miRNA-Dep-E3.5 embryos (fig. S15B). To investigate the potential impact of increased miRNAs on embryonic development, we assessed alteration of gene profiles by single-cell transcriptome RNA sequencing in sRNA-Dep-E3.5 versus sRNA-Ctl-E3.5. A total of 264 (107 up-regulated and 157 down-regulated) embryonic genes were identified as differentially expressed (fold change > 2 and P < 0.05) in sRNA-Dep-E3.5 (Fig. 5A). GO analysis of these differentially expressed genes identified enrichment of GO clusters whose dysfunction frequently contribute to neuropsychiatric abnormalities, such as synaptic signaling, neuronal differentiation, and neuron development (Fig. 5B and table S4). We assessed whether these differentially expressed genes were potentially regulated by the 17-miRNA set (16 up-regulated miRNAs and down-regulated miR-184). In total, 78 genes (1 up-regulated and 77 down-regulated) among the 264-gene set had the tendency to be directly targeted, and this number is significantly higher than that obtained under random simulations (Fig. 5C). Through literature mining, many genes among the 78-gene set were identified to be implicated in the modulation of neuronal function and pathophysiology (e.g., synaptic plasticity, dendritic spine formation, and nerve outgrowth) (30, 38–40). Among these putative miRNA-target pairs, App, Tspan7, Wnk3, Ly6a, Grin3a, and βCamkII were selected as the representative and specially characterized. Embryonic stem (ES) cells transfected with synthetic miRNA mimics showed reduction of these six proteins (fig. S15C), and a luciferase reporter assay confirmed direct binding of corresponding miRNAs to the 3′ untranslated regions (3′UTRs) of the six genes (fig. S15D). Theoretically, these neuronal genes that originally tend to be fine-tuned and precisely controlled in early embryonic period might be inappropriately disrupted and reprogrammed by inherited sperm miRNAs. In line with this hypothesis, aberrant expression of these genes was observed in developing embryos of F1-Dep versus F1-Ctl and sRNA-Dep versus sRNA-Ctl. In detail, while the expression levels of App, Tspan7, Wnk3, Ly6a, and Grin3a increased sharply from the four-cell stage to the morula stage in F1-Ctl embryos, the elevation of these genes was significantly delayed in F1-Dep embryos (Fig. 5D). In contrast, while βCamkII expression was maintained at a basal level in F1-Ctl embryos, its expression was markedly induced in F1-Dep embryos (Fig. 5D). Consistently, the altered gene profiles in early embryos of sRNA-Dep versus sRNA-Ctl recapitulated those of F1-Dep versus F1-Ctl (Fig. 5E). The results suggest that sperm sRNAs may imprint perturbations in the core neuronal circuits during early embryonic development.

(A) Scatter plot comparison illustrating differentially expressed genes in sRNA-Dep-E3.5 versus sRNA-Ctl-E3.5. Down-regulated genes are shown in green, and up-regulated genes are shown in red. (B) Functional annotation clustering of the differentially expressed genes according to GO categories. The x axis represents the negative log of the P values of the enrichment of the corresponding GO terms. The eight top-ranked GO clusters are listed. Green bars indicate P < 0.05; gray bars indicate P > 0.05 for unique GO terms. (C) Number of 264 random genes (107 up-regulated and 157 down-regulated) targeted by the 17-miRNA set (16 up-regulated and 1 down-regulated). Genes potentially targeted by the 17-miRNA set were predicted using TargetScan, and the output is compared to genuinely changed or randomly selected gene set for overlapping genes. The simulation results of 1000 replicates are shown in gray, and the observed genuine value is in green. (D and E) Line chart of the relative expression levels of App, Tspan7, Wnk3, Ly6a, Grin3a, and βCamkII in early embryos. Zygotes derived from F0-Dep or F0-Ctl (D) or injected with sperm sRNA from F0-Dep or F0-Ctl (E) were cultured, and the gene transcriptional changes were assessed across early embryonic stages (n = 3 pools). GAPDH, glyceraldehyde-3-phosphate dehydrogenase.
DISCUSSION
Despite overwhelming evidence for the transmission of parental depression to offspring in cohort studies (11, 41), the mechanism by which parental depression increases offspring risk is not well understood. Current consensus is that the interplay of genetic and environmental factors contributes to depressive symptoms (3, 7), but unravelling the detailed mechanism remains a unique challenge. In the past decade, there has been a considerable focus on the role of epigenetic mechanisms as a bridge between the genetic and environmental factors in the pathophysiology of depression. In essence, parental epigenetic changes acquired in response to environmental stimuli can be transferred via germ line to the subsequent generation in a non-Mendelian inheritance manner (9, 12). In particular, DNA methylation has been proposed as a major mechanism by which stresses interact with the genome, leading to stable changes in gene expression and development of depressive symptoms (42). Numerous studies have identified predominant DNA methylation alterations in genes involved in mediating resilience and vulnerability to stress (42). However, DNA methylation status, on its own, is unlikely to yield sufficient information to fully understand the biological basis of depression. In this study, we showed that F1 offspring born to or generated via IVF from F0 males of depression-like model are susceptible to depression-like behaviors, have abnormal neuronal gene expression profiles, and display enhanced HPA axis activity and impaired synaptic neurotransmission. These molecular, neuronal, and behavioral phenotypes provide solid evidence that paternal depression-like symptoms can be inherited by the offspring through the sperm. Such a father-to-offspring transmission simplifies the mechanistic dissections because it excludes the oocyte and gestational effects and validates again that sperm is the carrier of paternal epigenetic information. The results are also consistent with the concept that depression is the outcome of genetic-environmental interactions (3, 7) because F1 offspring born to F0-Dep appeared normal under basal conditions but were increasingly vulnerable to depression-like phenotypes when exposed to gradually enhanced CVS. Thus, epigenetic factors in paternal sperm interact with environmental stress exposure in offspring to increase the incidence of depression in offspring. Such a germline epigenetic inheritance mechanism paves a way for filling the gap in our knowledge of the pathophysiology of depression. In the future, great efforts should be directed to developing prevention and treatment methods, including the antidepressant treatments, for the susceptibility to stress-induced depression-like phenotypes in F1 offspring.
The molecular basis of sperm-mediated intergenerational inheritance remains unclear, but recent evidence points toward RNA (10). Proof of a direct causal role of sperm RNA in transferring acquired traits across generations in mammals originates from IVF experiments; that is, the injection of sperm RNA (total RNA or a subset of sperm RNAs) into normal zygotes can generate offspring phenotypes that recapitulate paternal inputs (16, 18, 21). For example, Benito et al. (43) showed that exposure of adult male mice to an environmental enrichment paradigm led to enhancement of synaptic plasticity and cognition in the next generation and that this effect might be mediated through sperm miRNAs. Chen et al. (18) provided the first evidence that sperm tsRNAs represent a paternal epigenetic factor that mediates intergenerational inheritance of diet-induced metabolic disorders. In a mouse model of paternal stress, Rodgers et al. (21, 44)found that nine sperm miRNAs were increased in the sperm of stressed males and associated with reduced HPA stress axis reactivity in offspring, possibly through reducing maternal mRNA stores in early zygotes. Here, we link sperm sRNA, particularly miRNAs, to the intergenerational inheritance of depressive-like traits and find that manipulating sperm sRNA and miRNA content in zygotes can confer depression vulnerability to offspring. Particularly, miRNAs are very sensitive to stress experience in sperm of F0-Dep, and the miRNA injection groups produced phenotypes nearly identical to those of F0-Dep, emphasizing the unique position of sperm miRNA as an interface between paternal experience and its consequences on offspring phenotypes. Recently, miRNAs have been found to be present in a remarkably stable form in the extracellular environment and facilitate cross-talk between cells, tissues, and even species (45–47). In this study, miRNAs are shown to be an intergenerational signal that can experience alterations from the paternal environment and facilitate cross-talk between generations. These findings extend our knowledge about the roles of miRNAs from the mobile signal between cells to a communication messenger between generations.
However, how sperm miRNAs translate environmental information across generations is poorly understood, especially how such a small amount of sperm miRNA may act postfertilization to enact long-term changes in offspring behaviors and physiology (35). A major challenge related to the study of mammalian epigenetic inheritance is the lack of causal proof to unambiguously demonstrate that the epigenetic changes acquired from parental experience can be efficiently relayed to the offspring to alter their gene expression and phenotypes (12). One mechanism could be that the inherited miRNAs affect gene regulatory networks from the embryo to adulthood via a transcriptional cascade. That is to say, the original inherited miRNAs should target key nodes in the gene regulatory networks of developing embryos, and then, the following chain reactions guide reprogrammed gene profiles in the brains of offspring toward depression-like phenotypes. This “butterfly effect” might exist in the development of neuropsychiatric diseases such as depression because even small changes in the early embryonic period can affect synaptic function and brain plasticity in adults (48, 49). By technologies such as single-cell transcriptome RNA sequencing, we assessed the effects of sperm sRNAs from F0-Dep on embryonic development and identified a dysregulated gene profile in early embryos. Particularly, aberrant expression of App, Tspan7, Wnk3, Ly6a, Grin3a, and βCamkII was characterized along with the developmental process, and all of these genes were confirmed to be the direct targets of the miRNAs differentially expressed in the stress-exposed sperm. Given the known roles of these genes in neural biology [e.g., App regulates synaptic structure and function (38); Tspan7 promotes dendritic spine formation and is required for spine stability and normal synaptic transmission (39); Grin3a is an important contributor in promoting nerve overgrowth (40); and increase of βCaMKII in LHb produces profound depressive symptoms (30)], their inappropriate expression may cause a cascade change and profound downstream effects in early neurons, thereby impairing the normal brain maturation and redirecting the developmental fate toward a vulnerable phenotype for stress-induced depression. Thus, inherited sperm miRNAs have the potential to imprint developmental abnormalities in the core neuronal circuits that lead to neuronal dysfunction during embryonic development. Although not fully understood, such a mechanism may be uniquely positioned to facilitate the conversion of initial tiny changes caused by sperm miRNAs into an amplified form of information to allow the risk for depression-like trait to be inherited intergenerationally. Future studies are need to explain how the altered transcriptional cascade is prolonged and penetrates the whole developmental process and eventually lead to high vulnerability to depression-like phenotypes in offspring.
There are some important points that deserve more in-depth discussion. First, we found that the depressive traits can be transmitted to the F1 but not F2 generation, which may result from the lack of miRNA changes in F1-Dep sperm under baseline condition. However, previous study (16) has shown that the stress phenotypes could be present in F2 generation. Specifically, maternal traumatic experiences in F0 female mice was found to alter sperm miRNA expression in F1 male offspring and behavioral and metabolic responses in both F1 and F2 offspring. Injection of sperm RNA from traumatized F1 males into fertilized wild-type oocytes could reproduce the behavioral and metabolic alterations in the resulting offspring. To some degree, the F1 generation (with dysregulated miRNAs in the sperm after maternal trauma stress) in the previous study is equivalent to the F0 generation (with dysregulated miRNAs in the sperm after CMS) in our study. These findings cross-validate that miRNAs are very sensitive to stress experience and that the dysregulation of miRNAs in sperm is a necessary condition to allow the risk for depression trait to be inherited intergenerationally. Second, we showed that the injection of lRNA fraction from F0-Dep did not result in depressive-like phenotypes in offspring, while a previous study (19) revealed that sperm lRNAs could participate in transmission of traumatic experiences from parent to offspring. Specifically, injection of lRNA fraction from sperm of males exposed to postnatal trauma recapitulates the effects on food intake, glucose response to insulin, and risk taking in adulthood, whereas the sRNA fraction alters body weight and behavioral despair, indicating that sperm sRNAs and lRNAs may have a distinct impact on the acquired phenotypes in offspring. Because our study focused on depressive-like phenotypes in offspring, we did not examine the behavioral changes on food intake, glucose response, and risk taking. Nevertheless, because sperm RNA–mediated epigenetic inheritance is still a very new research topic with many unanswered questions and many unsettled disputations, the consequence of sperm lRNA injection and related epigenetic inheritance mechanism deserves further investigation. Third, we showed that neutralization of the abnormal miRNAs in zygotes by antisense strands largely rescued the acquired depressive-like phenotypes in F1 offspring born to F0-Dep. However, some studies have shown that the use of antisense strands to “neutralize” sperm miRNAs might be different from the use of miRNA knockout mice (50, 51), because overdose of miRNA antisense injection will result in presence of redundant miRNA antisense strands in zygotes, which might generate off-target effects during embryonic development if the redundant antisense strands bind to undesired target genes. To avoid the risk of technological bias, CRISPR-Cas9 or miRNA sponge technology may be used to more precisely block the function of sperm miRNAs. Fourth, recent studies have shown that sperm rRNA-derived small RNAs (rsRNAs) are sensitively altered by diet in both mice (52) and humans (53) and may contribute to intergenerational inheritance. The rsRNA profile has also been reported to be notably associated with sperm quality (54). In this study, we analyzed differentially expressed rsRNAs in our RNA sequencing data using a stringent threshold (mean reads > 500, fold change > 2, and P < 0.05) and identified 45 rsRNAs (20 up-regulated versus 25 down-regulated) that were significantly altered in F0-Dep sperm compared with F0-Ctl sperm (fig. S11B). Thus, rsRNAs are indeed very susceptible to paternal stress. Whether sperm rsRNAs are involved in the inheritance of depression remains an untapped area and deserves further investigation.
In summary, this study reveals that depression-like phenotypes induced by paternal stress can be inherited by the offspring through a causal role of miRNAs in the sperm. Understanding the epigenetic inheritance mechanism of depression offers a crucial dimension for the development of antidepressant treatments.
MATERIALS AND METHODS
Study design
The objective of this study was to investigate whether paternal depression-like phenotypes acquired by stress exposure can be inherited by offspring via a causal role of miRNAs in the sperm. To confirm whether depressive-like traits in fathers are inherited by the offspring, male C57BL/6J littermates (8 weeks old) were randomly assigned into two groups: One group (F0-Dep) was used to establish a CMS-induced depression-like model by exposing male mice to unpredictable mild stresses daily for 5 weeks (detailed protocol of CMS is listed in table S5), and the other group (F0-Ctl) was set as nonstressed controls. Immediately after the CMS procedure, a portion of the stressed F0-Dep and nonstressed F0-Ctl was screened for body weight, behavioral performances (open field → SPT → FST), corticosterone levels, neuronal activation, and depression-related gene alteration to validate the successful establishment of depression-like model, and the rest of F0-Dep and F0-Ctl were separately mated with normal females to generate F1 offspring (F1-Dep and F1-Ctl). F1-Ctl and F1-Dep were also randomly assigned into different testing groups and separately screened for behavioral performances (open field → SPT → FST), corticosterone levels, neuronal activation, and hippocampal gene profiles under baseline conditions or were screened for behavioral performances and depression-related gene alteration after 2 weeks of CVS (detailed protocol of CVS is listed in table S5). To obtain F2 offspring, male F1-Ctl and F1-Dep were separately mated with normal females. Furthermore, four IVF approaches were conducted to causally test whether depressive-like traits in fathers are inherited by the offspring through the sperm, sperm total RNA, sperm sRNA, or sperm miRNA. Behavioral performances (SPT → FST), corticosterone levels, neuronal activation, and depression-related gene alteration were measured in the same way as mentioned above. All procedures were performed in accordance with the National Institutes of Health (NIH) Guide for the Care and Use of Laboratory Animals and approved by the Ethical Committee of Nanjing University. Investigators were blinded to group assignment during behavioral experiments.
Mice
Mice of the inbred C57Bl/6J strain were obtained from the National Resource Center of Model Mice (NRCMM) and Model Animal Research Center of Nanjing University (MARC) (Nanjing, China) and maintained on a 12-hour light/dark cycle (lights on at 7:00 a.m.) with free access to food and water, unless indicated.
Stress-induced depression-like models
Chronic mild stress. Male C57BL/6J littermates (8 weeks old) from NRCMM/MARC were subjected to CMS for a period of 5 weeks (detailed protocol is listed in table S5) (55). Briefly, mice were subjected to three of the following stresses during the day: wet cage, food deprivation, restraint, period of stroboscopic illumination (150 flashes per minute), inversion of light-dark cycle, tilted cage (45°), and loud noise (90 to 105 dB). All stresses and/or sequences were applied at different time points to avoid habituation and to add an element of unpredictability to the stresses. The corresponding controls were kept in the usual housing conditions without stress. Both control and stressed mice were weighed before CMS treatment and twice per week starting at the first week.
Chronic restraint stress. Male C57BL/6J littermates (8 weeks old) from NRCMM/MARC were subjected to CRS by placement in 50-ml conical tubes with holes for air flow for 2 to 3 hours per day for 14 consecutive days. During the restraint stress, mice were placed in separate sound- and light-attenuating boxes and then immediately returned to their home cages (28).
Chronic variable stress. To investigate whether mice are susceptible to stress and depression-like phenotypes, a 1-, 2-, or 3-week period of CVS was performed as described previously (34). Briefly, seven different slight stresses were randomized and administered one per day (detailed protocol is listed in table S5). The order of the seven stresses varied across weeks. Stresses were selected because they are nonhabituating, do not induce pain, and do not affect food or water intake, including constant light, exposure to fox odor (1:5000, 2,4,5-trimethylthiazole; Sigma-Aldrich, St. Louis, MO), novel object, restraint in a 50-ml conical tube, multiple cage changes, novel 100-dB white noise (Sleep Machine; Brookstone, Merrimack, NH) and saturated bedding overnight. Immediately after the CVS procedure, the mice in control and depression-like groups were screened for behavioral performances or depression-related gene alteration.
Behavioral tests
Forced swim test. FST, a predictive model of depressive-like behavior, was performed as described previously (56). Mice were individually placed in a vertical Plexiglas cylinder (25 cm in height and 18 cm in diameter) containing 15 cm of water at 25° ± 1°C and videotaped for 6 min. The total immobility time during the last 5 min of the test was measured by video analysis (TopView Animal Behavior Analyzing System; CleverSys Inc., Reston, VA). The water was changed between each animal. Investigators were blinded to group assignment in the FST.
Sucrose preference test. The SPT, a measure of anhedonia-like behavior in mice, was assessed in a two-bottle choice test (23). Mice were individually housed and had the free choice of drinking either a 1% sucrose solution or plain water (the left or right location of the water and sucrose bottles was balanced across mice). After 3 days of habituation, the consumption of water and sucrose was recorded for 24 hours (the positions of water and sucrose bottles were swapped after 12 hours to control for positional preference). Sucrose preference was calculated as a percentage of the sucrose intake over the total fluid intake. Investigators were blinded to group assignment in the SPT. Because sucrose is a metabolic confound, we also tested the F1 offspring born to stress-induced F0-Dep or nonstressed F0-Ctl with 0.3% saccharin (57), a noncaloric sweetener, to rule out the potential confounding effect of caloric intake in SPT.
Open-field test. Mice were tested in an open field (50 cm by 50 cm by 40 cm) lit with a 60-W bulb placed above the field with no interference noise or any other jamming in a room with dim light (58). After placing a mouse at the center of the arena, locomotor activity was recorded for 5 min by a video camera. Locomotor distance and body movement velocity were analyzed by Clever TopScan Software (Clever Sys Inc., Reston, VA).
Corticosterone assessment
To measure basal corticosterone levels, submandibular blood samples were obtained directly from the home cage condition, using animal lancets, from 7:00 to 9:00 a.m. Blood samples were collected into EDTA-coated tubes, and plasma was isolated after centrifugation of the blood samples at 2000g for 20 min at 4°C. Corticosterone in 10 μl of plasma was measured using an enzyme-linked immunosorbent assay kit (Enzo Life Sciences, NY) according to the manufacturer’s instructions. Three replicates were measured for each sample.
Breeding scheme
F1 offspring. Following completion of the CMS/CRS procedure, control males and CMS/CRS-stressed males were mated with primiparous normal C57Bl/6J females for one to three nights. Pregnancy was established by confirmation of a copulation plug (identified each morning within 1 hour after the lights were turned on) and signaled immediate removal of the female to her own cage. Breeding resulted in litters (F1-Dep versus F1-Ctl) sired from F0 generation of control and depression-like model. The breeding of F1-Dep and F1-Ctl was done at the same time and in the same conditions. On day 21 of life, pups of the same gender were randomly housed five per cage and were randomly assigned to different experimental conditions to minimize the potential confound resulting from litter effects. F1-Dep and F1-Ctl were screened for depression-like symptoms at 2 months of age.
F2 offspring. To obtain the second generation (F2-Dep versus F2-Ctl), adult F1-Ctl and F1-Dep males (without stress exposure, 8 to 10 weeks old) were bred with primiparous normal C57Bl/6J females. F2-Dep and F2-Ctl were screened for depression-like symptoms at 2 months of age.
RNA isolation and quantitative RT-PCR analyses of mRNA, miRNA, tsRNA, and piRNA
Total RNA was isolated from tissues and sperm using TRIzol Reagent (Invitrogen, Carlsbad, CA) according to the manufacturer’s instructions. For quantitative RT-PCR analysis of mRNA, 1 μg of total RNA was reverse-transcribed to complementary DNA (cDNA) using AMV reverse transcriptase (TaKaRa, Dalian, China) and oligo(dT) primer (TaKaRa). Quantitative RT-PCR was performed using a SYBR Green PCR kit on an Applied Biosystems 7300 Sequence Detection System. Analysis of gene expression was performed using the △△CT method, and relative gene expression was normalized to β-actin mRNA levels. Three replicates were measured for each sample. Primer sequences are listed in table S6.
For miRNA analysis (59), 100 ng of total RNA was reverse-transcribed to cDNA using AMV reverse transcriptase (TaKaRa) and stem-loop RT primer (Applied Biosystems). Quantitative RT-PCR was performed using a TaqMan PCR kit on an Applied Biosystems 7300 Sequence Detection System. The relative miRNA expression was normalized to U6 small nuclear RNA (snRNA). Three replicates were measured for each sample.
For tsRNA and piRNA analyses (18), 100 ng of total RNA was reverse-transcribed to cDNA using the miScript II RT Kit (QIAGEN, Hilden, Germany). In a reverse transcription reaction with miScript HiFlex Buffer, piRNA or tsRNA is first polyadenylated by poly(A) polymerase and converted into cDNA by reverse transcriptase with universal RT primer. Subsequently, quantitative PCR was performed using the miScript SYBR Green PCR Kit (QIAGEN) with a specific forward primer and a universal reverse primer (primer sequence is listed in table S6). After the reaction, the lengths of the RT-PCR products were elongated. The relative expression of tsRNA and piRNA was normalized to U6 snRNA. Three replicates were measured for each sample. To validate the specificity of each primer set, no-template controls for each piRNA and tsRNA were assessed simultaneously. In addition, the PCR products was confirmed by electrophoresis and by TA cloning and sequencing. A total of 24 piRNAs and 5 tsRNAs were correctly and efficiently amplified by quantitative RT-PCR, and the no-template controls amplified at a much higher cycle range than these piRNAs and tsRNAs (fig. S16).
Western blot analysis
Samples from tissues and cells were sonicated in radioimmunoprecipitation assay buffer [0.5% NP-40, 0.1% sodium deoxycholate, 150 mM NaCl, and 50 mM tris-HCl (pH 7.5) with phenylmethylsulfonyl fluoride] (1:100, Beyotime Biotechnology, China). The samples were centrifuged at 12,000g for 10 min at 4°C, and the supernatant was retained for Western blot analysis. The bicinchoninic acid (BCA) colorimetric method was used to determine the total amount of protein. Equal amounts of protein (30 to 60 μg) were resolved via 10 to 12.5% SDS–polyacrylamide gel electrophoresis (SDS-PAGE) and then transferred to a polyvinylidene difluoride (PVDF) membrane (Millipore, Bedford, MA). Detection was based on a fluorescent secondary antibody that was visualized using the Tanon 5200 Multi detection system (Tanon, Shanghai, China). The data were quantified using ImageJ software (NIH, Bethesda, MD), and the relative protein expression was normalized to the value of β-actin. Information on primary antibodies is listed in table S7.
To conduct analyses on five different proteins (GluA1, GluA2, GluN2A, GluN2B, and CamkII) and one internal control (β-actin) in a limited amount of hippocampus and mPFC tissues with six different antibodies, sliced bands from the same blot were used in this study. On the basis of the apparent molecular weight of GluA1, GluA2, GluN2A, GluN2B, CamkII, and β-actin (~110, ~115, ~175, ~180, ~65, and 42 kDa) (fig. S17), the PVDF membrane was cut (at 70- and 130-kDa marker) into three parts (0 to 70 kDa, 70 to 130 kDa, and 130+ kDa). The three parts were then first blotted with GluN2A (175 kDa), GluA1 (110 kDa), and β-actin (42 kDa) antibodies, respectively, and detected with a fluorescent secondary antibody. Both primary and secondary antibodies were then removed using antibody removal solution (Beyotime Biotechnology), blocked again, and blotted with GluN2B (180 kDa), GluA2 (115 kDa), and CamkII (65 kDa) antibodies, respectively. The same experiment was repeated three times, and in each biological repeat, all sliced membranes are stripped only once (blotted twice). It did happen, however, that some antibodies did not work well because of repeated membrane washing, in which case we would rerun the SDS-PAGE and reblot with the antibody of trouble together with its own β-actin control (and that is why more than one internal control was shown for one set of experiment).
Immunofluorescence
Immunofluorescence was performed as previously reported (23, 60). Briefly, mice were deeply anesthetized with sodium pentobarbital (65 mg/kg) and perfused transcardially with 20 ml of normal saline, followed by 100 to 150 ml of 4% paraformaldehyde in 0.1 M phosphate buffer. The brain was gently removed, trimmed, and postfixed in the same fixative for 12 hours at 4°C and then cryoprotected with 30% sucrose for 48 hours. Frozen coronal sections (20 μm in thickness) containing the PVN, hippocampus, or mPFC were acquired by a freezing microtome (CM3050S, Leica, Wetzlar, Germany) and mounted on gelatin-coated slides. The slices were rinsed with phosphate-buffered saline (PBS) containing 0.1% Triton X-100 and then incubated in 10% normal bovine serum in PBS containing 0.1% Triton X-100 for 30 min. Sections were incubated overnight at 4°C with the following primary antibodies: rabbit anti–c-Fos, chicken anti-NeuN, and goat anti–corticotropin-releasing factor. After a complete wash in PBS, the sections were incubated in the appropriate secondary antibodies (1:2000, Invitrogen) for 2 hours at room temperature in the dark. The slices were washed and mounted in Fluoromount-G mounting medium (SouthernBiotech, Birmingham, AL). Incubations replacing the primary antiserum with control immunoglobulins and/or omitting the primary antiserum were used as negative controls. The micrographs were taken with a TCS SP8 inverted laser scanning confocal microscope (Leica). Digital images from the microscope were recorded with LAS X Viewer software (Leica). Cell counts were performed using Image-Pro Plus 6.0 software (Media Cybernetics Inc., Rockville, MD) in combination with manual scoring to ensure accuracy. All counting was performed by an investigator who was blinded to the experimental group. Information on primary antibodies is listed in table S7.
Brain slice preparation and whole-cell patch-clamp recordings
Adult mice (25 to 30 g, 10 to 12 weeks) were used for whole-cell recordings. After the mouse was decapitated under sodium pentobarbital (40 mg/kg) anesthesia, the brain was quickly removed and cooled in ice-cold standard artificial cerebrospinal fluid (ACSF; composition: 124 mM NaCl, 2.5 mM KCl, 1.25 mM NaH2PO4, 1.3 mM MgSO4, 26 mM NaHCO3, 2 mM CaCl2, and 10 mM d-glucose) saturated with 95% O2/5% CO2. Coronal slices (300 μM in thickness) containing the hippocampus or mPFC were cut with a vibroslicer (VT 1200S, Leica Microsystem, Wetzlar, Germany) according to the mouse brain atlas. The slices were stored for at least 1 hour in a holding chamber filled with 95% O2 and 5% CO2 oxygenated ACSF at 35 ± 0.2°C before any experiment was started.
Whole-cell patch-clamp recordings were performed as previously reported (23, 60). All EPSC recordings were made with electrodes filled with a solution containing the following: 120 mM cesium methanesulfonate, 20 mM CsCl, 10 mM Hepes, 0.2 mM EGTA, 10 mM sodium phosphocreatine, 5 mM QX-314, 4 mM Na2–adenosine 5′-triphosphate, and 0.4 mM Na–guanosine 5′-triphosphate (pH 7.2) (290 to 330 mOsm). The electrode resistance in the bath solution was 5 to 7 megohms, and series resistance (< 25 megohms) was monitored continuously to ensure stability within 20%. Whole-cell patch-clamp recordings were performed on the pyramidal neurons, the principle neurons in the hippocampal area CA3 and the prelimbic (PrL) area of mPFC using an Axopatch 200B amplifier (Axon Instruments, Foster City, CA), and data were filtered at 2 kHz and digitized at 5 kHz using pClamp10 software. The sEPSCs were recorded at a holding potential (−65 mV) in the presence of the SR95531 (20 μM; Tocris Bioscience, Bristol, UK), which was used to block γ-aminobutyric acid type A receptor–mediated inhibitory postsynaptic currents.
RNA sequencing
RNA library construction. Mice from the F0-Ctl, F0-Dep, F1-Ctl, and F1-Dep groups were euthanized at 2 months of age, and three pooled hippocampal samples (each sample was pooled from three independent mice) were processed for RNA extraction. Transcriptome libraries were constructed using the TruSeq Stranded mRNA Library Prep Kit (Illumina, San Diego, CA). For each RNA library, 4G base pairs (raw data) were generated by Illumina HiSeq 4000. After base composition and quality tests were passed, adapter sequences, sequences with a high content of unknown bases (unknown bases > 10%), and low-quality reads were removed. The clean reads were used for downstream bioinformatics analysis.
Data analysis. Kallisto was used to quantify gene expression counts by pseudo-align to the mouse GRChM38 [mm10, downloaded from GENCODE (www.gencodegenes.org), and Release M24 (GRCm38.p6) version was used in our analysis] transcripts. The results were imported to DESeq2 for normalization and differential expression analysis by using tximport. Significance was set at an adjusted P < 0.1 for broad pattern identification. Heatmaps were generated using the pheatmap R package, and GO analysis was performed using DAVID Bioinformatics Resource 6.8.
RRHO analysis. Full differential expression lists were ranked by gene set enrichment analysis. RRHO analysis was used to evaluate the overlap of differential expression lists between paired regions. A one-sided version of the test looking for only overenrichment was used. RRHO difference maps were produced for pairs of RRHO maps (F0-Dep versus F0-Ctl and F1-Dep versus F0-Ctl) by calculating the normal approximation of difference in the log odds ratio and SE of overlap between F0-Dep versus F0-Ctl and F1-Dep versus F0-Ctl for each pixel. This Z score was then converted to a P value and corrected for multiple comparisons across pixels.
Sperm sample collection and sRNA sequencing
Sperm isolation. Mature sperm were extracted from the cauda epididymis of male mice of the C57BL/6J background and processed for RNA extraction as previously described (18). Briefly, sperm were released from the cauda epididymis into 5 ml of PBS [130 mM NaCl, 10 mM Na2PO4, 1.7 mM KH2PO4, and 2 mM KCl (pH 7.4)] maintained at 37°C for 15 min and then filtered with a 40-μm cell strainer to get rid of the tissue debris. The sperm were then treated with somatic cell lysis buffer (0.1% SDS, 0.5% Triton X-100 in DEPC H2O) for 40 min on ice to eliminate somatic cell contaminants and pelleted by centrifugation at 600g for 5 min. After removal of the suspension, the sperm pellet was resuspended, washed twice in 10 ml of PBS, and then pelleted at 600g for 5 min. The purity of the eluent was confirmed by inspecting the eluted sperm cells under a light microscope. The sperm pellet was added with TRIzol Reagent and homogenized, followed by RNA extraction.
sRNA library construction and sequencing. All sRNA library construction and deep sequencing were performed by BGI (Shenzhen, China). Briefly, sRNA libraries were constructed according to the TruSeq Small RNA Sample Pre Kit (Illumina). After library quality validation, raw data for each sRNA library were generated on the Illumina HiSeq 4000 platform. Sequence reads that fit any of the following standard quality control criterion parameters were removed: (i) reads with N (more than four bases whose quality score is lower than 10 or more than six bases whose quality score is lower than 13), (ii) reads with 5′ primer contaminants or without a 3′ primer, (iii) reads without the insert tag, (iv) reads with ploy A, and (v) reads shorter than 18 nt. The clean reads were obtained after data filtration.
Data processing and analysis. Precursor and mature miRNA sequences, tRNA sequences, piRNA sequences, and rRNA sequences were obtained from miRBase v21, GtRNAdb, piRNABank, and National Center for Biotechnology Information, respectively. Bowtie was used to align clean reads to these reference sequences for annotation. To annotate miRNA, only candidates with one mismatch and no more than two shifts were counted as miRNA matches. To annotate piRNA, only candidates with one mismatch were counted as piRNA matches. To annotate tsRNA and rsRNA, SPORTS 1.1 (61) based on bowtie was used for tsRNA and rsRNA annotation. For normalization, the total sequencing frequency of each type of sRNA in each sample was normalized to 1,000,000. Differential analysis was performed using Student’s t test. Significance was set at uncorrected P < 0.05 for broad pattern identification. A fold change threshold was set at >2. The average expression level threshold was set at >500.
Microinjection of sperm RNA, sperm sRNA, sperm lRNA, and synthetic RNA and transfer of embryos
Total RNA was extracted from sperm using TRIzol Reagent (Invitrogen). sRNA and lRNA were extracted from sperm using the MirVana Protein and RNA Isolation System (Ambion, Austin, TX). Synthetic miRNA mimics, antisense strands, and scrRNA were purchased from GenePharma (Shanghai, China). According to the information provided by the manufacturer, miRNA mimics are synthetic double-stranded RNA oligonucleotides that specifically mimic endogenous mature miRNAs; they are designed and modified to ensure that the correct strand, representing the desired mature miRNA, is taken up into the RNA-induced silencing-like complex responsible for miRNA activity. MiRNA antisense strands are single-stranded, chemically modified oligonucleotides designed to specifically bind to and inhibit endogenous mature miRNAs. MiRNA antisense strands share exact complementarity with the miRNA and can form a tight duplex with the miRNA guide strand, therefore preventing the miRNA from binding to its intended target because of the steric blocking. Sequences of synthetic miRNA mimics and antisense strands are listed in table S8.
Total RNA, sRNA, or lRNA was adjusted to a concentration of 2 ng/μl. Equal amounts of 16 chemically synthetic miRNA mimics and/or antisense strands were mixed and adjusted to a concentration of 2 ng/μl (each miRNA mimic or antisense strand is 0.125 ng/μl). This amount (2 ng/μl) is approximately equal to the total RNA of 10 sperm according to previous reports (16, 18). All RNAs were microinjected into zygotes of the C57Bl/6J background using a Leica microinjection system. The zygotes were then cultured in M16 (Sigma-Aldrich) at 37°C in 5% CO2. The two-cell embryos were transferred to the oviduct of the surrogate mother of the ICR background. The offspring of each group (RNA-Dep versus RNA-Ctl, sRNA-Dep versus sRNA-Ctl, lRNA-Dep versus lRNA-Ctl, and miRNA-Dep versus scrRNA-Ctl) were screened for behavioral performances, corticosterone levels, neuronal activation, and depression-related gene alteration until adulthood.
Approximately 300 embryos were injected for each condition, and 80 to 85% implanted embryos survived up to E3.5, 30 to 35% to E5.5, and 30 to 35% until adulthood. There was no significant difference in the embryo survival rate between the depression-like model and control groups in each developmental stage.
Early embryo collection and single-cell transcriptome RNA sequencing
Early embryo collection. sRNAs isolated from F0-Dep or F0-Ctl mouse sperm with a concentration of 2 ng/μl were microinjected into zygotes of the C57Bl/6J background. The zygotes were then cultured in M16 medium (Sigma-Aldrich) at 37°C in 5% CO2. On the second day, the two-cell embryos were transferred to potassium-supplemented simplex optimized medium (KSOM, Millipore). Embryos at the two-cell, four-cell, eight-cell, and blastocyst stage were collected at approximately 18, 42, 76, and 96 hours after microinjection, respectively. To remove the zonapellucida, the selected embryos were transferred into an acidic solution drop (1 ml of PBS supplemented with 1 ml of 36% HCl), and all the embryos without zonapellucida were washed carefully in Dulbecco’s Phosphate Buffered Saline several times to remove all the potential maternal contaminants. In addition, some two-cell embryos were transferred to the oviduct of the surrogate mother of the ICR background, and embryos were collected from the uterus on E5.5. A single blastocyst-stage embryo was suspended in RNA lysis reagents and frozen at −80°C, ready for RNA sequencing processing. In addition, two-cell (30), four-cell (30), eight-cell (30), blastocyst (20), and E5.5 (5) embryos were pooled at each developmental stage, and total RNA was isolated from these early embryos using the Arcturus PicoPure RNA Isolation Kit (Applied Biosystems, Carlsbad, CA) according to the manufacturer’s instructions for quantitative RT-PCR analysis.
Single-cell transcriptome RNA library construction. The collected single blastocyst-stage embryos (E3.5) were lysed to release all RNAs, which were then reverse-transcribed into first-strand cDNA using the SMART-Seq v4 Ultra Low Input RNA Kit for Sequencing (Clontech, Mountain View, CA). Single-cell transcriptome RNA sequencing was performed by Novogene (Beijing, China). After base composition and quality tests were passed, the sequence of adapters, high content of unknown bases (unknown bases > 10%), and low-quality reads were removed. The clean reads were used for downstream bioinformatics analysis.
miRNA target prediction, cell transfection, and luciferase reporter assay
Target prediction. We retrieved validated and predicted targets of miRNAs using the computational algorithm TargetScan. The detailed binding sites between miRNAs and target genes were visualized as a diagram.
Cell transfection. E14TG2a ES cells were provided by Stem Cell Bank, Chinese Academy of Sciences. The E14TG2a cells were cultured in N2B27 medium (Invitrogen) with 2i (PD0325901: 1 μM, Selleck, Houston, TX; CHIR99021: 3 μM, Selleck) and Lif (1000 U/ml, Merck Millipore) and maintained feeder free on a dish coated with poly-l-ornithine (0.01%, Sigma-Aldrich) and laminin (10 ng/ml, BD Biosciences). For cell transfection, ES-E14TG2a cells were seeded in 12-well plates, and each well was transfected with 50 pmol of miRNA mimics using Lipofectamine 3000 (Invitrogen) according to the manufacturer’s instructions. Total RNA and protein were isolated 24 or 48 hours after transfection.
Luciferase reporter assay. To test the direct binding of miRNAs to the target genes, a plasmid carrying the luciferase gene linked to a fragment of the target gene 3′UTR harboring putative miRNA binding sites was cotransfected into human embryonic kidney (HEK) 293T cells along with scrRNA or miRNA mimic (Genepharm). To test the binding specificity, the sequences that interacted with miRNA seed sequences were mutated, and the mutant 3′UTRs were inserted into an equivalent luciferase reporter. HEK293T cells were cultured in Dulbecco’s minimum essential medium (Gibco, Carlsbad, CA) containing 10% fetal bovine serum and seeded in 24-well plates. At 24 hours after plating, 0.2 μg of firefly luciferase reporter plasmid, 0.1 μg of β-galactosidase expression vector (catalog no. 10586-014, Ambion, Carlsbad, CA), and equal amounts (20 pmol) of miRNA mimic or scrRNA were transfected into cells with Lipofectamine 2000 (Invitrogen) according to the manufacturer’s instructions. The β-galactosidase plasmid was used as a transfection control. At 24 hours after transfection, the cells were analyzed using a luciferase assay kit (catalog no. E4550, Promega, Madison, WI). All experiments were performed in triplicate wells for each condition and repeated three times independently.
Data statistics
All statistical tests were performed under the open-source statistics package R or using GraphPad Prism software 7 (San Diego, CA). Normality and equal variances between group samples were assessed using Shapiro-Wilk test and Brown-Forsythe tests, respectively. When normality and equal variance were achieved between sample groups, one-way analysis of variance (ANOVA) followed by Bonferroni’s multiple comparisons test (Figs. 1J; 3B; and 4, D and F to J), two-way ANOVA followed by Bonferroni’s multiple comparisons test (Fig. 1, B and I), t test (Figs. 1, C, E, and L; 2, G and H; and 3, D to F, I, and K to M), or multiple t test (Figs. 1, F, G, M, and N; 2, D to F; 3, G, H, and J; 4B; and 5, D and E) was used. Where normality or equal variance of samples failed, Kruskal-Wallis one-way ANOVA followed by Dunn’s correction (Figs. 1K, 3C, and 4E) or Mann-Whitney U test (Fig. 1D) was performed. Differences are considered statistically significant at P < 0.05. *P < 0.05; **P < 0.01; ***P < 0.001.
Acknowledgments: Funding: This work was supported by the National Natural Science Foundation of China (nos. 32030044, 31871295, 31741075, 32022015, 31871295, 32000549, 31900824, 92049109, and 31961160724), Jiangsu Key Research and Development Program (nos. BE2016737 and BE2018714), Natural Science Foundation of Jiangsu Province (BK20190008), the Fundamental Research Funds for the Central Universities (no. 020814380146), China Postdoctoral Science Foundation (2019 M651779), and National Postdoctoral Program for Innovative Talents (no. BX20180139). This work was also partially supported by a research grant from the State Key Laboratory of Reproductive Medicine (SKLRM-K201801). Author contributions: X.C., J.-N.Z., C.-Y.Z., Y.W., and H.L. designed the study. Y.W., H.H., J.L., F.J., S.Z., X.Z., and X.-R.C. conducted the behavioral test, RT-PCR, and Western blots. Z.-P.C. performed the immunofluorescence and whole-cell patch-clamp experiments. Y.W. prepared sperm, hippocampus, and early embryos samples for deep sequencing. Z.Z. and J.L. performed RNA sequencing analyses. B.Y., L.C., and R.M. carried out the IVF and RNA injection experiments. Y.W., J.Z., G.L., and M.X. performed luciferase reporter assay and cell transfection. Y.W., Z.-P.C., and Z.Z. analyzed data. X.C., J.-N.Z., and C.-Y.Z. wrote the manuscript with the assistance of Y.W., Z.-P.C., and Z.Z. Competing interests: The authors declare that they have no competing interests. Data and materials availability: Raw data from RNA sequencing of hippocampal samples, sRNA sequencing of sperm samples, and single-cell transcriptome RNA sequencing from early embryo have been deposited in GEO under the accession code GSE133498. Quantitative data that support the findings of this study are available within the paper and the Supplementary Materials. All other data that support the findings of this study are available from the corresponding author on reasonable request.